Index
![]()

Review: It’s all about value
Today we’ll have some fun with AMD’s latest desktop APU, the Trinity based A10-5800K. Launched two months ago, the new chip features Piledriver CPU cores with revamped Radeon graphics. It’s also AMD’s first APU to fit the new FM2 socket (904 pins versus Llano’s 905). So obviously Llano users will not be able to upgrade to Trinity without the added cost of a new motherboard. We used MSI’s FM2-A85XA-G65 to run our benches.
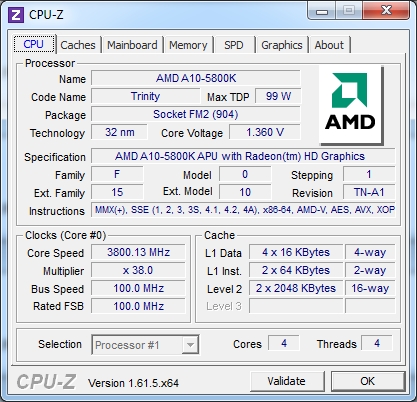
The A10-5800K has four CPU cores and brings support for the latest ISA instructions including FMA3, F16C, AVX, AVX.1, AES. The CPU clock is 3800MHz and the max Turbo frequency is 4.2 GHz.
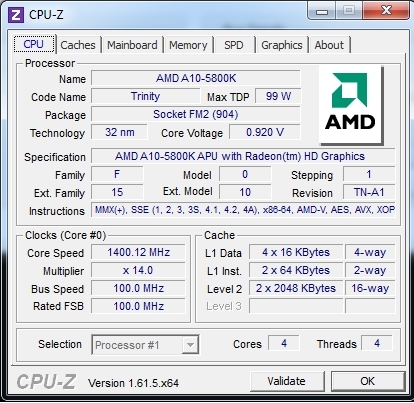
Turbo Core 3 also got an extensive overhaul. It is more advanced than previous versions and it can identify exactly what part of the APU is under the highest load. In other words, it can detect whether more power is needed for the CPU or GPU part, which should translate into better power efficiency, as it will target different parts of the chip independently.
Trinity also supports DDR3-1866MHz memory and the RAM speed has a significant impact on performance. We already proved this in one of our earlier reviews, so check it out if you need more details.
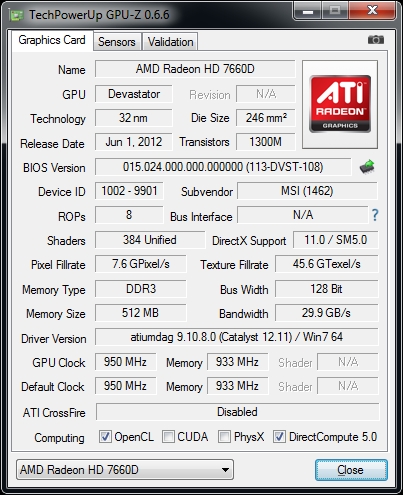
The A10-5800K features HD7660D graphics, based on Northern Islands Radeon HD6000 series GPUs. It features VLIW4 architecture and of course it is DirectX 11 enabled. The HD7660D features 384 shaders and it is clocked up to 800MHz, depending on the load. It also features the UVD3 video encoder, so it includes a H.264 video encoder and Blu-Ray support.
AMD also allows users to harness HD7660D graphics in tandem with discrete Radeon boards, using the Dual Graphics feature. It basically allows users to boost graphics performance by adding low-end discrete graphics, which is a pretty neat feature for gamers on a budget. AMD Eyefinity is also on board and it delivers 3 + 1 monitor support.
Sadly we didn’t have a comparable Intel CPU handy, so our review will focus on a Trinity vs. Llano showdown instead.
CPU: AMD A10-5800K
CPU-Cooler: Antec Kühler h2o 620
Memory: Corsair Vengeance LP PC3-12800 (1600MHz) 8GB (2x4GB) Kit (9-9-9-24)
Hard disk: Intel SSD 80GB
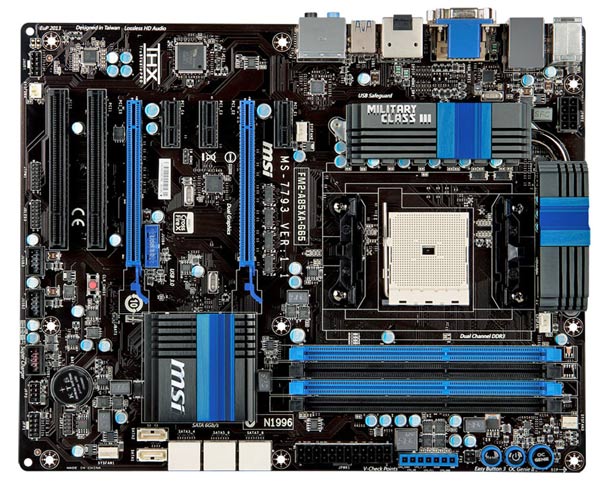
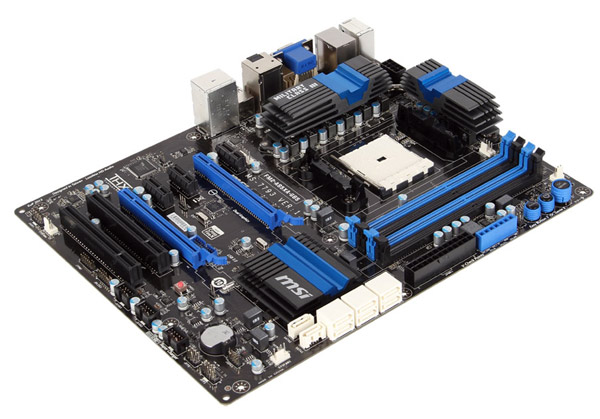
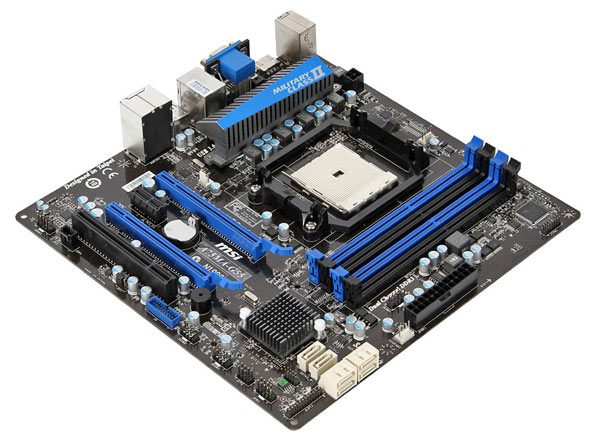
Motherboard: MSI FM2-A85XA-G65
Specifications:
- Socket FM2
- CPU (Max Support) AMD A10/A8/A6/A4-series
- Chipset AMD A85X
- DDR3 Memory DDR3 1066/1333/1600/1866/2133/2400*(OC)
- Memory Channel Dual
- DIMM Slots 4
- Max Memory (GB) 64
- PCI-Ex16 2
- PCI-E Gen Gen2 (1x16, 1x8)
- PCI-Ex1 3
- PCI 2
- SATAIII 8
- RAID 0/1/5/10
- LAN 10/100/1000*1
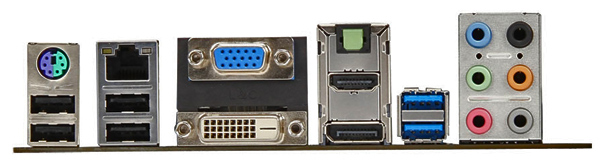
- USB 3.0 ports (Rear) 2
- USB 2.0 ports (Rear) 4
- Audio ports (Rear) 6
- Display Port 1
- VGA 1
- HDMI 1
- DVI 1
- VGA Max Share Memory (MB) 1024
- DirectX DX11
- Form Factor ATX
- CrossFire Y
- Hybrid CrossFire Y
- Dual Graphics Y
CPU: AMD A8-3870K
CPU-Cooler: Antec Kühler h2o 620
Memory: Corsair Vengeance LP PC3-12800 (1600MHz) 8GB (2x4GB) Kit (9-9-9-24)
Hard disk: Intel SSD 80GB
Motherboard: MSI A75MA-G55
Specifications:
- Socket AM3+
- CPU (Max Support) FX
- FSB/BCLK/Hyper Transport Bus up to 5200MT/s
- Chipset AMD® 990FX+SB950
- DDR3 Memory DDR3 800/1066/1333/1600/1866*/2133*(OC)
- Memory Channel Dual
- DIMM Slots 4
- Max Memory (GB) 32
- PCI-Ex16 2
- PCI-E Gen Gen2 (2x16)
- PCI-Ex1 4
- PCI 1
- SATAIII 6
- RAID 0/1/5/10
- LAN 10/100/1000*1
- TPM 1
- USB 3.0 ports (Rear) 2
- USB 2.0 ports (Rear) 8
- Audio ports (Rear) 6+Coaxial SPDIF/Optical SPDIF
- Form Factor ATX
- SLI Y
- CrossFire Y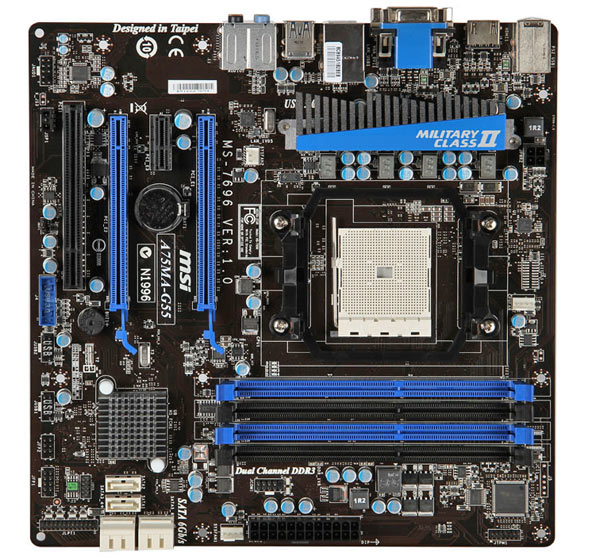
PCMark is a complete PC benchmark that measures overall system performance during typical desktop usage across a range of activities such as handling images and video, web browsing and gaming.
PC Mark 7 with XFX HD 7850 Black Edition
Test: Overall Performance
Comparison: Generated Score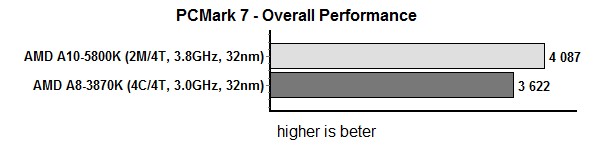
PC Mark 7 with IGP
Test: Overall Performance
Comparison: Generated Score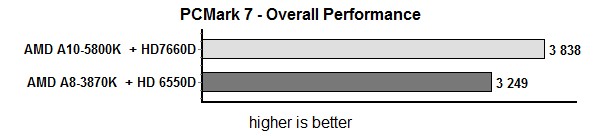
As you can see from the scores, PC Mark 7 really likes AMD’s new APUs. The A10-5600K with integrated HD 7660D graphics is only 6 percent slower than the same test with discrete HD 7850 graphics. The A10-5800K is 18 percent faster than the A10-3870K.
3DMark 11 makes extensive use of all the new features in DirectX 11 including tessellation, compute shaders and multi-threading.
3DMark 11 with XFX HD 7850 Black Edition
Test: Performance preset
Comparison: 3DMark 11 Score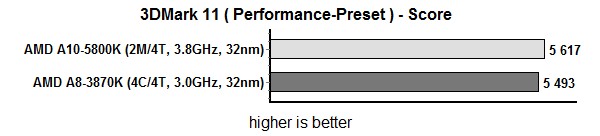
3DMark 11 shows that swapping out CPUs in a rig running HD 7850 will not significantly improve gaming results. Using the A10-5800K resulted in 2 percent higher scores.
The following tests shows that if you’re relying on IGP performance alone, replacing the A8-3800K with A10-5800K is a smart move – the score improved by almost 37 percent.
3DMark 11 with IGP
Test: Performance preset
Comparison: 3DMark 11 Score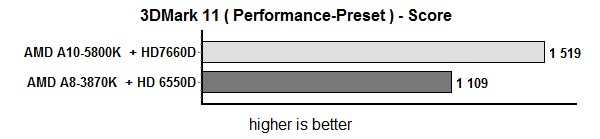
Synthetic Gaming Benchmarks - Unigine Heaven
Heaven Benchmark is a DirectX 11 GPU benchmark based on advanced UNIGINE engine. It reveals the enchanting magic of floating islands with a tiny village hidden in the cloudy skies. Interactive mode provides emerging experience of exploring the intricate world of steampunk. It is the first DirectX 11 benchmark in the world, the original version was released at the moment of Microsoft Windows 7 launch in October, 2009. The distinguishing feature of the benchmark is hardware tessellation, a scalable technology aimed for automatic subdivision of polygons into smaller and finer pieces, so that games gain drastically detailed and more elaborated look.
Heaven DX11 Benchmark with XFX HD 7850 Black Edition
Test: Tessellation (Normal)
Comparison: Average FPS Score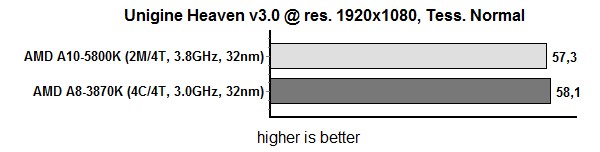
Thanks to the A8-3870K, HD 7850 scored slightly better. This is not the only test where the A8-3800K showed superior processing power, but more on that later. When tessellation tasks are moved to the IGP, the HD 7660D beats the HD 6550D by 42.4 percent.
Heaven DX11 Benchmark with IGP
Test: Tessellation (Moderate)
Comparison: Average FPS Score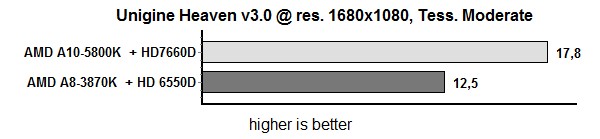
SiSoftware Sandra (the System ANalyser, Diagnostic and Reporting Assistant) is a 32 and 64-bit Windows system analyser that includes benchmarking, testing and listing modules. It tries to go beyond other utilities to show you more of what is really going on under the hood so you draw comparisons at both a high and low-level in a single product.
Change Log for Sandra 2013:
- Updated Device Performance Certification
- New Drivers/Firmware Notification
- Windows 8 support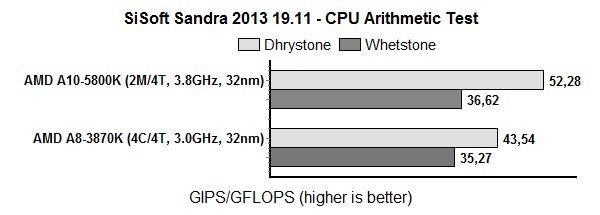
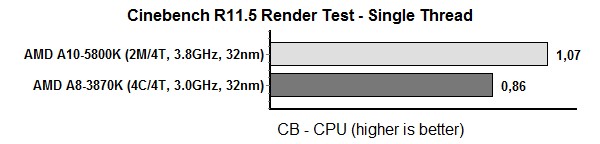
The latest benchmark from MAXON, Cinebench R11.5 uses all of your system's processing power to render a photorealistic 3D scene (from the viral "No Keyframes" animation by AixSponza). This scene makes use of various algorithms to stress all available processor cores.
In fact, Maxon Cinebench can measure systems with up to 64 processor threads. The test scene contains approximately 2,000 objects which in turn contain more than 300,000 polygons in total, and uses sharp and blurred reflections, area lights, shadows, procedural shaders, antialiasing, and much more. The result is displayed in points (pts). The higher the number, the faster your processor.
Cinebench 11.59 64-bit Single Thread
Test: Single CPU Image Render
Comparison: Generated Score
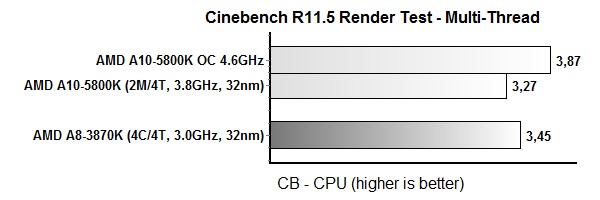
Cinebench 11.59 64-bit Multi Thread
Test: Multi CPU Image Render
Comparison: Generated Score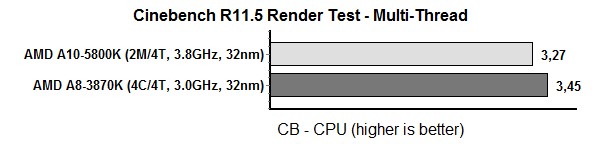
Due to the instruction sets and code paths being used within CineBench R11.5, the A10-5800K ends up 5.5 percent slower than the A8-3870K in SMP test. However, the A10 wins the Single Thread test by 24.4 percent.
Simply put, x264 HD Benchmark is a reproducible measure of fast your machine can encode a short HD-quality video clip into a high quality x264 video file. It's nice because everyone running it will use the same video clip and software. The video encoder (x264.exe) reports a fairly accurate internal benchmark (in frames per second) for each pass of the video encode and it also uses multi-core processors very efficiently. All these factors make this an ideal benchmark to compare different processors and systems to each other. Read more here.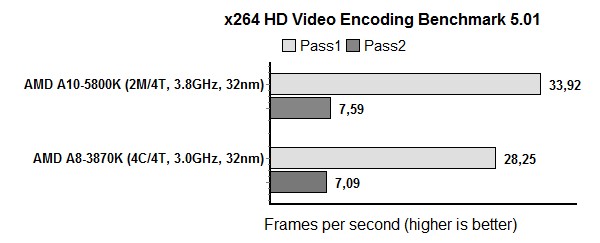
In the first pass of X264 benchmark encoding tests, AMD’s A10-5800K ran 20 percent faster than A8-3870K. The second pass, which is much more demanding and CPU intensive, reduced the advantage to 7 percent.
Aliens vs. Predator D3D11 Benchmark is a standalone benchmark test based upon Rebellion's 2010 inter-species shooter Aliens vs. Predator. In addition to other DX11 eye candy, the test also heavily relies on tessellation.
Aliens vs Predator with XFX HD 7850 Black Edition
API: DirectX 11
Quality: Very High
Resolution: 1920x1080
Anti-Aliasing: 4X
Anisotropic Filtering 16X
Texture Quality: Very High
Shadow Quality: Very High
SSAO: On
Tessellation: On
Advanced Shadows: On
Comparison: Average FPS
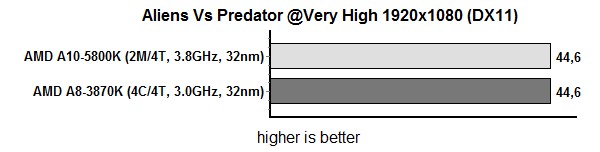
There were some differences in gaming scores when the integrated GPU was used, but this wasn’t the case when discrete HD 7850 came into play.
Aliens vs Predator with IGP
API: DirectX 11
Quality: Medium
Resolution: 1920x1080
Anti-Aliasing: 0X
Anisotropic Filtering 4X
Texture Quality: Medium
Shadow Quality: Medium
SSAO: On
Tessellation: On
Advanced Shadows: Off
Comparison: Average FPS 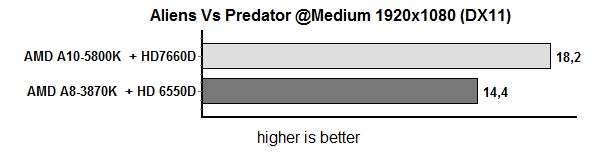
At 1920x1080, integrated HD 6550D managed 11.1 fps, which is 26 percent slower than the HD 7660D.
Crysis 2 with XFX HD 7850 Black Edition
API: DirectX 11 (DirectX 11 Upgrade Patch)
Hi-res Texture: On
Quality: High
Resolution: 1920x1080
Anti-Aliasing: 4X
Map: Central Park
Runs: 3
Comparison: Average FPS 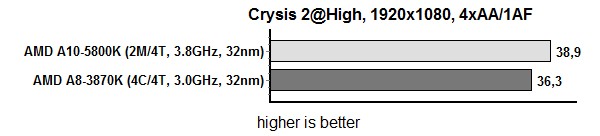
Crysis is one of the games that liked A10-5800K and it scored 7 percent higher than A8-3870K.
Crysis 2 with IGP
API: DirectX 11 (DirectX 11 Upgrade Patch)
Hi-res Texture: Off
Quality: High
Resolution: 1680x1050
Anti-Aliasing: 0X
Map: Central Park
Runs: 3
Comparison: Average FPS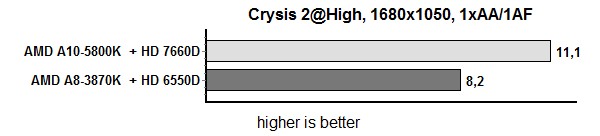
At 1680x1050, integrated HD 7760D graphics scored 11.1 fps, which is 35 percent better than HD 6550D.
Sniper Elite V2 with XFX HD 7850 Black Edition
API: DirectX 11
Resolution: 1920x1080
Texture Detail: Ultra
Shadows Detail: Ultra
Draw Distance: Ultra
Anti-Aliasing: High
Advanced Shadows: Low
Supersampling: 2.25x
Anisotropic Level: 16
Compute Shaders: On
Ambient Occlusion: On
Motion Blur: On
Comparison: Average FPS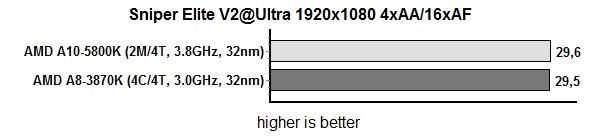
Sniper Elite V2 with IGP
API: DirectX 11
Resolution: 1680x1050
Texture Detail: Medium
Shadows Detail: Medium
Draw Distance: Medium
Anti-Aliasing: Off
Advanced Shadows: Low
Supersampling: Off
Anisotropic Level: 1
Compute Shaders: Off
Ambient Occlusion: Off
Motion Blur: Off
Comparison: Average FPS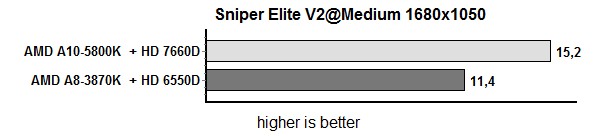
At 1680x1050, integrated HD 7760D scored 15.2 fps, which is 33 percent higher than HD 6550D.
We tested the A10-5800K on MSI’s FM2-A85XA-G65 motherboard. First we tried overclocking the CPU, then the graphics and we finished it all off with some memory overclocking. The graphics proved the most troublesome in terms of overclocking. We encountered a few massive freezes, forcing us to power down the test rig. CPU and memory freezes weren’t as serious and we could restart the rig.
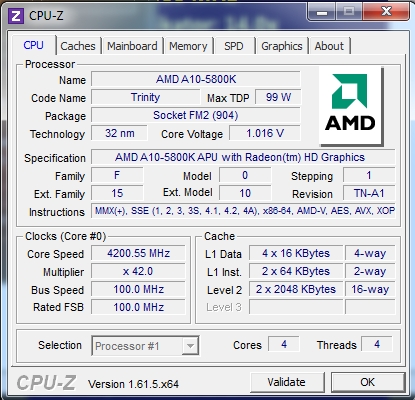
CPU overclocking
Before we overclocked the CPU we switched off Turbo Core and AMD Cool n’ Quiet. We jacked up the voltage to 1.5V and hit 4.6GHz with relative ease. With better equipment and know-how, it should be possible to push the chip even higher, but even the 4.6GHz clock resulted in significant benchmark gains. Bear in mind that the same APU on the same MSI board managed to hit 7.3GHz with some LN2 cooling. However, the clock was attained only after two out of four CPU cores were disabled.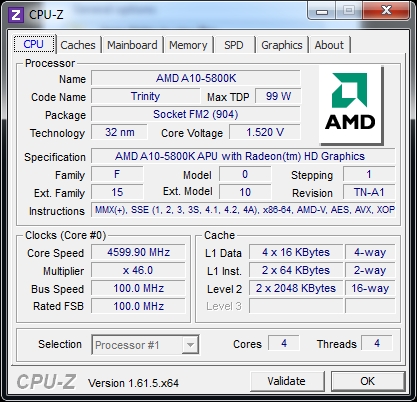
In any case, Cinebench shows improvements after our relatively mild overclock. The single thread results went up by 11 percent, while the multithread test shot up by 18 percent.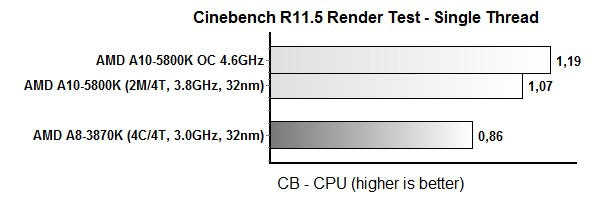
The CPU overclock did not have much effect in gaming, since the GPU clock was not changed. We saw practically no difference in Crysis 2 or AvP, but in Sniper Elite 2 we saw some improvement. Basically if you are trying to squeeze out more performance in games, it is crucial to overclock the memory and GPU.
Memory overclocking
Memory speed is very important for graphics performance, so we tried playing around with some Corsair DDR3 1600 modules, clocked at 1033, 1600 and 1866MHz.
Extensive bios settings allowed us to measure the effect of memory speed on overall performance, with no changes to CPU or GPU clocks. There is no official support for DDR3 2400 memory, but we gave it a try anyway. We used Corsair Vengeance CMZ8GX3M2A2400C10 memory and increased the FSB clock to push the clock beyond 2133MHz. Sadly though, we got to 2133MHz, but we could not start the system at 2400MHz.
IGP memory speed mirrors system memory speed. If you wish to increase memory bandwidth, and in turn IGP performance, we can do that by overclocking system memory. AMD advises users to use system memory running at 800MHz (DDR3 1600) or higher.
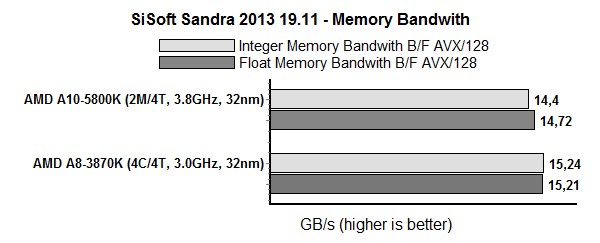
We managed to get DDR1866 speeds from Corsair Vengeance LP modules, rated at DDR3 1600. As you can see, the results of memory overclocking (DDR3 1866) are clearly visible in bandwidth numbers.
Aliens vs Predator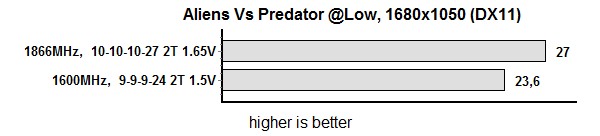
Overclocking the memory from 800MHz to 933MHz improved the gaming scores up to 14 percent. This number is closer to 30 percent when you compare 666MHz and 933MHz memory.
Crysis 2 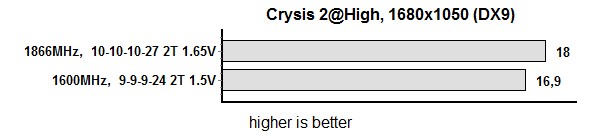
Overclocking the memory from 800MHz to 933MHz improved the gaming scores by about 8 percent. This number is closer to 18 percent when you compare 666MHz and 933MHz memory.
Sniper Elite V2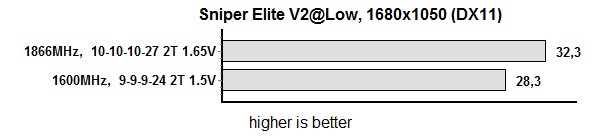
Overclocking the memory from 800MHz to 933MHz improved the gaming scores up to 14 percent. This number is closer to 17 percent when you compare 666MHz and 933MHz memory.
IGP overclocking
We also tried boosting the GPU clock from 800MHz to 950MHz, but as you can see in our results, memory overclocking had a much bigger impact on performance. AMD claims the GPU can be pushed north of 1GHz, but it seems we just ran out of luck and didn’t cross the 1GHz threshold.
|
|
CPU 4.2HGz, Memory 1600MHz GPU 800MHz |
CPU 4.2HGz, Memory 1600MHz GPU 950MHz |
|
Aliens vs Predator @low 1680x1050 |
23.6 |
23.9 |
|
Sniper Elite V2 |
28.3 |
28.7 |
Combined Overclocking
With a CPU clock of 4.5GHz, memory at 1866MHz and the GPU clock at 950MHz, we managed to get some impressive results. We got playable frame rates at 1680x1050, but just barely, since we had to reduce detail levels to attain them. Of course, bear in mind that we are talking about integrated graphics, so the results are actually pretty good. Just a few years ago, you couldn’t get close to decent frame rates in last generation games on any IGP.
|
|
CPU 4.2HGz, Memory 1600MHz GPU 800MHz |
CPU 4.5HGz, Memory 1866MHz GPU 950MHz |
|
Aliens vs Predator @low 1680x1050 |
23.5 |
27.9 |
|
Sniper Elite V2 @low 1680x1050 |
28.4 |
33.3 |
Power Consumption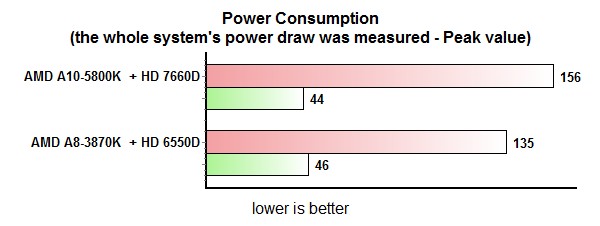
While idling, the Trinity-based A10-5800K proved much more efficient than the Llano generation. However, under full load we still see pretty high consumption, but the A10-5800K also delivers significantly higher performance over the A8-3870K.
The AMD A10-5800K is designated as an "Accelerated Processing Unit," which basically denotes a CPU coupled with integrated graphics. This particular SKU is the A-series flagship for 2012. CPU performance is on par with the FX 4170, but of course the A10-5800K also packs integrated graphics.
The A10-5800K features HD 7660D graphics, but although the HD 7000 designation might suggest it features the latest tech, it is actually based on AMD’s Northern Islands architecture, used on the HD 6000 series. However, although the HD 7660D is not a Southern Islands part, it is still the fastest integrated GPU around.
Pitted against Llano’s HD 6550D, the HD 7660D delivers up to 33 percent performance boost. However, it is still just an integrated solution, so it doesn’t have enough muscle for 1080p gaming. Older games, casual titles and even some less demanding current-gen games should be playable though. So for casual gamers who want to avoid the cost and noise involved in discrete graphics, the HD 7660D should be good enough, almost as good as entry level discrete cards.
However, Trinity’s new Pildedriver cores don’t offer the same improvements over Llano. In some CPU tests the old A8-3870K even outperformed the A10-5800K, but on the whole the latter is somewhat faster.
Since memory speed has a significant effect on overall performance, our advice is to go for 1866MHz modules, or at least 1600MHz. With record low memory prices, investing in somewhat faster modules could result in significant performance gains at a very low cost.
Speaking of costs, the A10-5800K can be yours for about €110 in Euroland, or $120 in the US. Coupled with a mid-range FM2 motherboard, the platform cost is still relatively low, under €/$200 in most cases. What’s more, even low-end boards are feature packed, which is not always the case with Intel motherboards in this price range. Bear in mind that quad-core Trinity chips are also available in 65W flavor, which was not always the case with Llano. The bad news? Well, owners of FM1 boards won’t be able to upgrade their Llanos.
Overall Trinity is a step in the right direction. It’s not revolutionary, it’s basically Llano done right, and it still offers unbeatable value for money.