Index
The latest benchmark from MAXON, Cinebench R11.5 uses all of your system's processing power to render a photorealistic 3D scene (from the viral "No Keyframes" animation by AixSponza). This scene makes use of various algorithms to stress all available processor cores.
In fact, Maxon Cinebench can measure systems with up to 64 processor threads. The test scene contains approximately 2,000 objects which in turn contain more than 300,000 polygons in total, and uses sharp and blurred reflections, area lights, shadows, procedural shaders, antialiasing, and much more. The result is displayed in points (pts). The higher the number, the faster your processor.
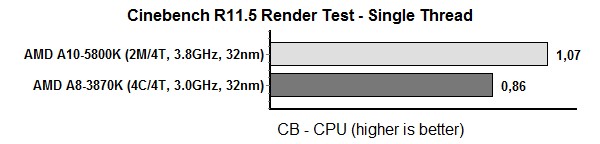
Cinebench 11.59 64-bit Single Thread
Test: Single CPU Image Render
Comparison: Generated Score
Cinebench 11.59 64-bit Multi Thread
Test: Multi CPU Image Render
Comparison: Generated Score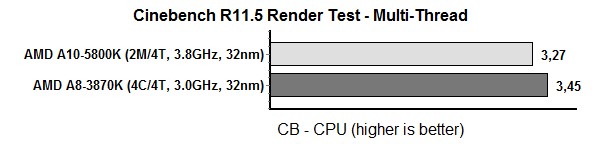
Due to the instruction sets and code paths being used within CineBench R11.5, the A10-5800K ends up 5.5 percent slower than the A8-3870K in SMP test. However, the A10 wins the Single Thread test by 24.4 percent.